

Custom RSI for Web Webull
RSI with EMA Strategy for Webull
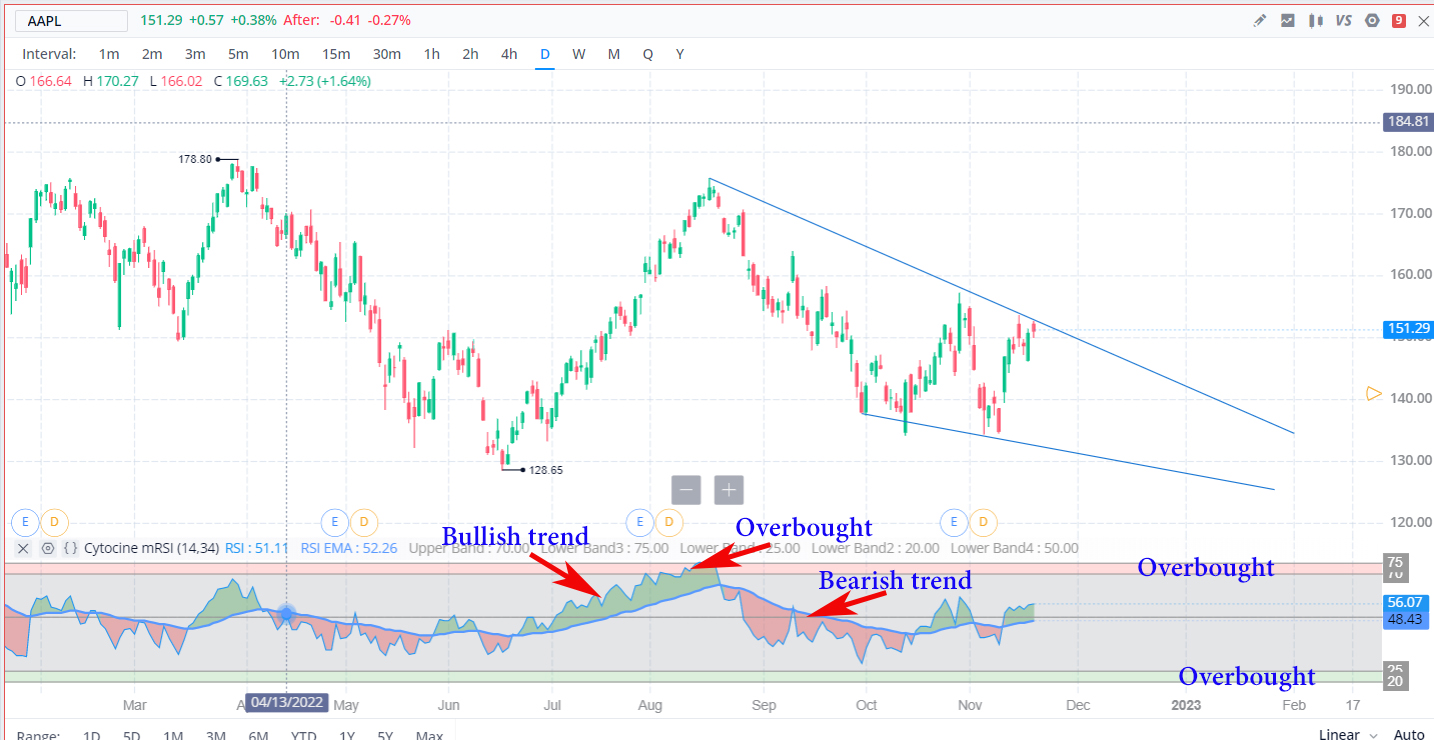
This indicator combines the Relative Strength Index (RSI) with an Exponential Moving Average (EMA) to identify momentum shifts and trend confirmation in Webull.
Components:
RSI (Relative Strength Index)
Measures market momentum and overbought/oversold conditions.
Typically set to 14 periods (adjustable).
Values:
Above 70 = Overbought (possible reversal or pullback).
Below 30 = Oversold (potential buying opportunity).
EMA (Exponential Moving Average)
A smoothed moving average that gives more weight to recent prices.
Common settings: 9, 21, or 50 periods for trend confirmation.
Used to filter RSI signals to avoid false breakouts.
How It Works:
Bullish Signal: RSI crosses above EMA, indicating strengthening momentum.
Bearish Signal: RSI crosses below EMA, signaling potential weakness.
Trend Confirmation:
RSI stays above the EMA during strong uptrends.
RSI remains below the EMA during downtrends.
Trading Strategy:
✅ Buy Signal:
RSI is rising above its EMA and above 30.
Confirmation: Price is above a longer EMA (e.g., 50 EMA).
❌ Sell Signal:
RSI falls below its EMA and under 70.
Confirmation: Price is trending below a key EMA level.
Best for:
✔ Swing Trading
✔ Trend Confirmation
✔ Momentum-Based Entries
This strategy helps avoid false RSI signals by requiring confirmation from an EMA, improving accuracy in Webull trading. 🚀

